
Currently, my Instagram feed is overrun by social media influencers trying or selling the ‘next new thing’ to slow down ageing. This is hardly surprising as skincare is big business and, for many people, its products are a part of everyday life. In 2023, the revenue of the United Kingdom skincare market was roughly £3.45 billion [1]. As expected with such a competitive and profitable industry it is inundated with hundreds of different products that claim to do the same thing but with often wildly varying price points.
Consequently, skincare and cosmetic consumers and influencers actively look for cheaper alternatives, commonly known as ‘dupes’. This is a product that performs the same or similar when compared to a more expensive high-end or luxury product but at an affordable price point for the consumer. For example, take Elf Cosmetics’ £7 ‘Hydrating Core Lip Shine’ in the shade Ecstatic which became an extremely popular dupe for Clinique’s viral £24 ‘Almost Lipstick’ in the shade Black Honey [2].
Beyond influencer hearsay and price, how do we really know if a dupe is truly comparative? As a data scientist and avid skincare fan, this question piqued my interest. Could I use data science to help cut through the noise of influencers and easily find a suitable dupe? Could data and the right method help me find an affordable dupe (same ingredients and ratios as the original product) on my own?
Data and Dupes
Data science is about organising and simplifying data, and navigating it with statistical techniques to find solutions. In the case of finding a skincare product dupe, it would be easiest to define it as a ‘nearest neighbour search’ (NNS) problem [3]. Essentially, a NNS searches a dataset to find the closest or most similar data point to a given data point. In this case, the dataset would be information available about skincare products and the given point would be the product we would want to find a dupe for.
Nearest Neighbour Search Explained
The search is conducted by calculating the distance between the given data point and all other data points and returning the closest data points which are its nearest neighbours. The distance measured is calculated in n-dimensional vector space, where n corresponds to the number of features or characteristics describing a data point. This is best explained by Figure 1.
Figure 1 illustrates an x-y graph which represents a two-dimensional vector space where each point (p) has an x and y value corresponding to its position in this vector space. The distance between two points is determined based on these values. Let us define q as the point for which we want to find the nearest neighbours and p1, p2 and so on as all the other points in the dataset. The distances between q and each point p are shown as the black lines on the plot below. We can see the nearest neighbour to point q is point p1 followed by p4, then p5 and finally p3. This would mean that the skincare product represented by p1 is the closest in likeness to the product represented by q.
In n-dimensional vector space, instead of two values, n-values describe a point's position in space, but the distance between points can similarly be determined.
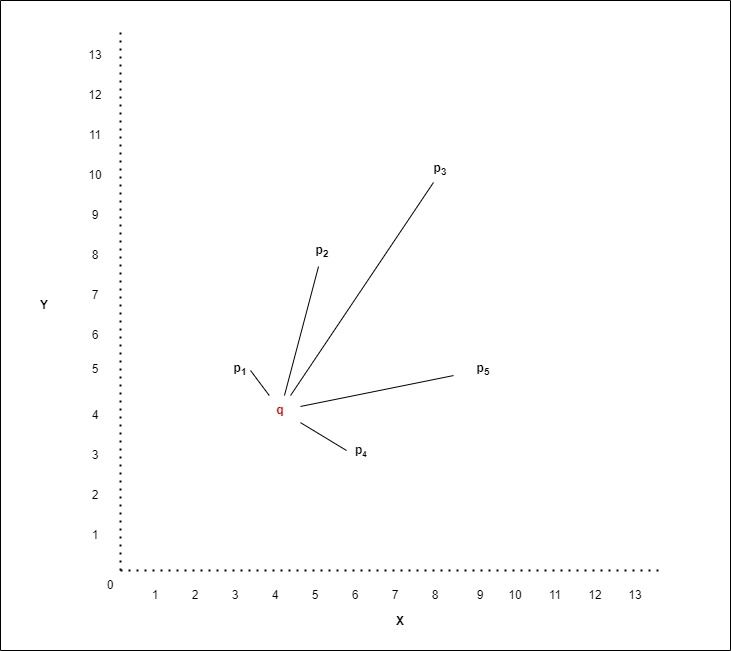
Figure 1: 2-dimensional graph showing the distance between two points.
Nearest Neighbour Search and Skincare
The following example puts NNS into practice using a skincare dataset from Kaggle [4]. The dataset contains over 1000 skincare products with their ingredients and prices listed. The number of ingredients found within the dataset is equal to the total number of dimensions. There are 2571 different ingredients listed in this dataset, therefore the dimensional space is n=2571.
Ideally, the values for each of the n dimensions would represent the precise percentage of an ingredient within a product. However, that detailed compositional data was unavailable. Instead, the values are derived from the relative abundance of ingredients, based on the order they are listed on the product label. By convention, ingredients are listed in descending order by weight or volume. Therefore, if a product contains x number of ingredients, the values assigned to the corresponding x dimensions are the descending order of those ingredients in the list. The ingredient listed first receives the highest value of x, the second ingredient receives x-1, and so on. If an ingredient is not present in a product then a value of zero is assigned to its dimension.
Figure 2 plots an approximate representation of these products in a two-dimensional space. A type of dimension reduction called t-SNE has been performed to visualise the relative distance between products in 2571-dimensional space as accurately as possible in two-dimensional space [5].
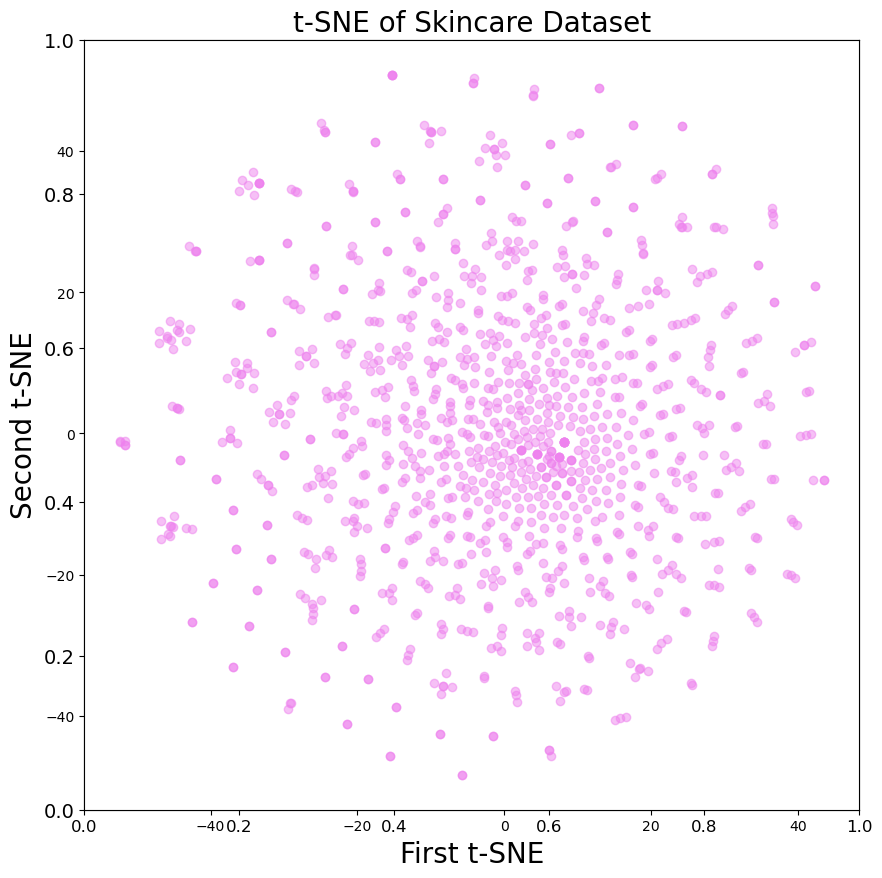
Figure 2: Products plotted in 2-dimensional space.
Useful results can be obtained by applying NNS to Kaggle’s skincare dataset. For example, the results of the nearest neighbour search (based on ingredients and their abundance) highlight that the closet dupes to Clinique Moisture Surge 72 Hour Moisturiser (£37) were La Roche-Posay Hydraphase Intense Masque (£18) and The Ordinary’s Vitamin C Suspension Cream 30% in Silicone (£6.10). Other examples included First Aid Beauty Ultra Repair Cream (£25), where the results indicated that La Roche-Posay Hydraphase Intense Masque (£18) and Indeed Labs Squalane Facial Oil (£19.99) were its closest dupe. It is evident that when focused on the ingredients in skincare data science can be used to suggest reasonable alternatives.
While these suggested dupes may not be identical to the original product they are similar enough to function as substitutes. The approach taken could therefore form the foundation for a service allowing consumers to find suitable skincare alternatives at varying price points. Moreover, we can look beyond skincare as using NNS could have wider implications for our daily lives, from comparing ingredients within our food to finding new music.