
Should you marry into the British royal family? It’s a question most of us have had to face at some point or another. And to mark the fortieth anniversary of the ill-fated wedding of Prince Charles and Lady Diana Spencer on 29 July 1981, Aleph Insights has looked into whether the data can be of any assistance. Are royal weddings more or less likely to lead to happy marriages? And which pairings - royal-to-royal, royal-to-commoner, or commoner-to-commoner - are most successful, and by how much? This post summarises some of our findings and discusses the methodological and data difficulties that surround attempts to answer even superficially-straightforward questions such as these. If for some reason you’re more interested in royal scandals than in data analysis methodology, feel free to scroll down to the analysis section.
Data
The first step in answering this question was to put together data about British ‘royal marriages’, that is, marriages in which at least one spouse is a member of the royal family. Unfortunately, and perhaps surprisingly, there’s no official definition of the ‘royal family’. So we decided to use a fairly restricted definition of a ‘royal’, which includes only reigning monarchs of Great Britain (which was created with the Treaty of Union in 1707) or the United Kingdom (created by the Acts of Union in 1800) and their immediate, legitimate, offspring. Further excluding people who never married, this leaves 43 distinct individuals, from Queen Anne through to Prince Edward, Earl of Wessex, who jointly took part in 48 marriages. For each of these, we gathered details on spouses, lifespans, length of marriage, and the reason for its ending (in most cases the death of one party, but including annulment, lack of recognition, dissolution, separation, and good old-fashioned divorce).
The observant reader will notice that this definition excludes a number of key partnerships. For instance, it excludes the marriages of Princes William and Harry, since they are only a monarch’s grandchildren rather than direct offspring. But it also excludes the weddings of illegitimate monarchical offspring - of which there are a considerable number (William IV had ten children by Dorothea Jordan, collectively responsible for nine weddings). But we had to draw the line somewhere - the data was being gathered by hand from a range of sources, and we have day jobs.
Because we were interested in outcomes when royals married commoners, we also needed to alight on a definition of a ‘commoner’ - again, not something for which an ‘official’ definition exists. To make things easy, we decided that a commoner was someone born to two unlanded parents, including those born to a mere knight, and those (like Lord Snowden) who were only ennobled later in life. The list of commoner spouses is rather short, comprising Maria Fitzherbert, Wallis Simpson, Anthony Armstrong-Jones, Camilla Parker-Bowles, Mark Phillips, Timothy Lawrence, Sarah Ferguson and Sophie Rhys-Jones. Yes, you’re more likely to see them in a Waitrose than an Aldi, but none of their parents were lords or ladies.
Ideally, we wanted to compare the outcomes of these 48 royal marriages with those of the less-regal wider population. This is not a trivial task, since we were going back to the 1600s. Figures for numbers of weddings and divorces are published by the ONS covering about the last 200 years; estimating equivalent figures back further than this requires copious use of assumptions, drawn in some cases from secondary sources such as academic studies of marriage records, and too boring to list here. Suffice to say that there are simply no reliable data covering the ways that most marriages ended, if not in divorce (e.g. in separation), which means prior to divorces being made available to everyone by the Matrimonial Causes Act of 1857, we don’t have a way of comparing the success of royal marriages with those of the general public. Even where data on divorce numbers is available (from 1858 onwards, broadly), these are not until recent years matched with marriages in a way that enables us to see how long marriages lasted for, or to examine the pattern of marriage survival over time. This data is published for recent years, but this significantly shrinks the pool of royal match-ups with which they can be compared.
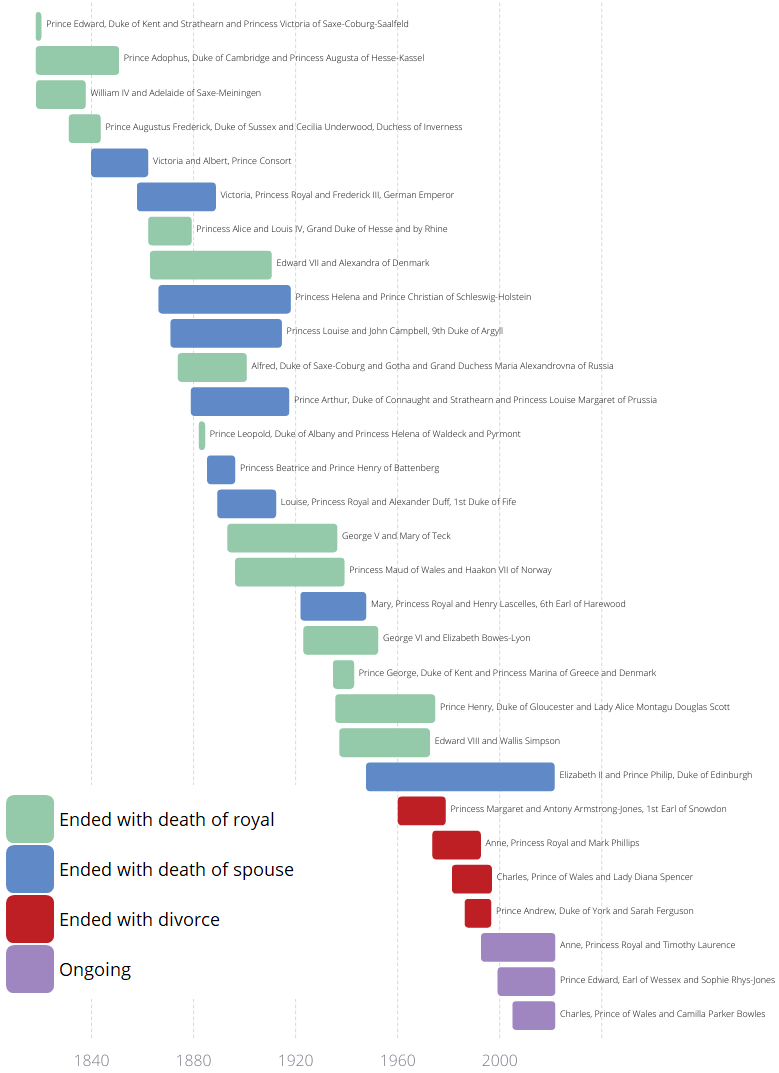
The chart below depicts the timeline, duration, and reason for conclusion of the last thirty royal marriages in our dataset.
Methodological Issues
As with many other questions that are easily asked, and putting aside data issues, the question of how successful royal marriages are is not easily answered. For one thing, what constitutes success or failure in a marriage? Is a marriage lasting twenty years and ending in divorce (like Princess Anne’s to Mark Phillips) more or less successful than one lasting two years and ending in death (such as that between Prince Leopold, Duke of Albany and Princess Helena of Waldeck and Pyrmont)? And what about unhappy marriages - or marriages in which both partners separate within a year but spend thirty years technically married?
To make matters measurable, we decided to simply look at whether the marriage ended in death, which we count as a success for the marriage (unfortunate as the event may be), or in divorce, annulment, dissolution, or a lack of recognition (which we count as a failure). However, even a relatively simple question such as ‘what proportion of marriages end in divorce?’ is not straightforward to answer, due to at least two further problems: the longevity of most marriages, and the dynamic nature of divorce rates over time.
The first issue is a problem in particular for recent years, since so many marriages (and three royal ones) are still ongoing. There are two options: treat these ongoing marriages as successful, or simply remove them from the dataset. The first option will tend to bias our estimate of the success rate upwards (we still don’t know for sure whether Prince Charles, Prince Edward, or Princess Anne will get divorced from their current spouses at some point, though here’s hoping they won’t).
Removing ongoing marriages from the dataset, on the other hand, is easy to do for the royal marriages, but near-impossible to do for the wider population: the data simply don’t allow us to identify which past marriages have already ended due to a spouse’s death (which we are counting as a success) or are still ongoing and thus should be excluded from the data. There is no uncontroversially right answer here, so our approach has been to simply compare the total number of marriages with those of divorces over a rolling forty-year window, for both royals and the wider population, and simply note the problems with this approach. As well as being a reasonable estimate for the average length of a ‘good marriage’, the forty-year timespan is partly the reason for this blog post.
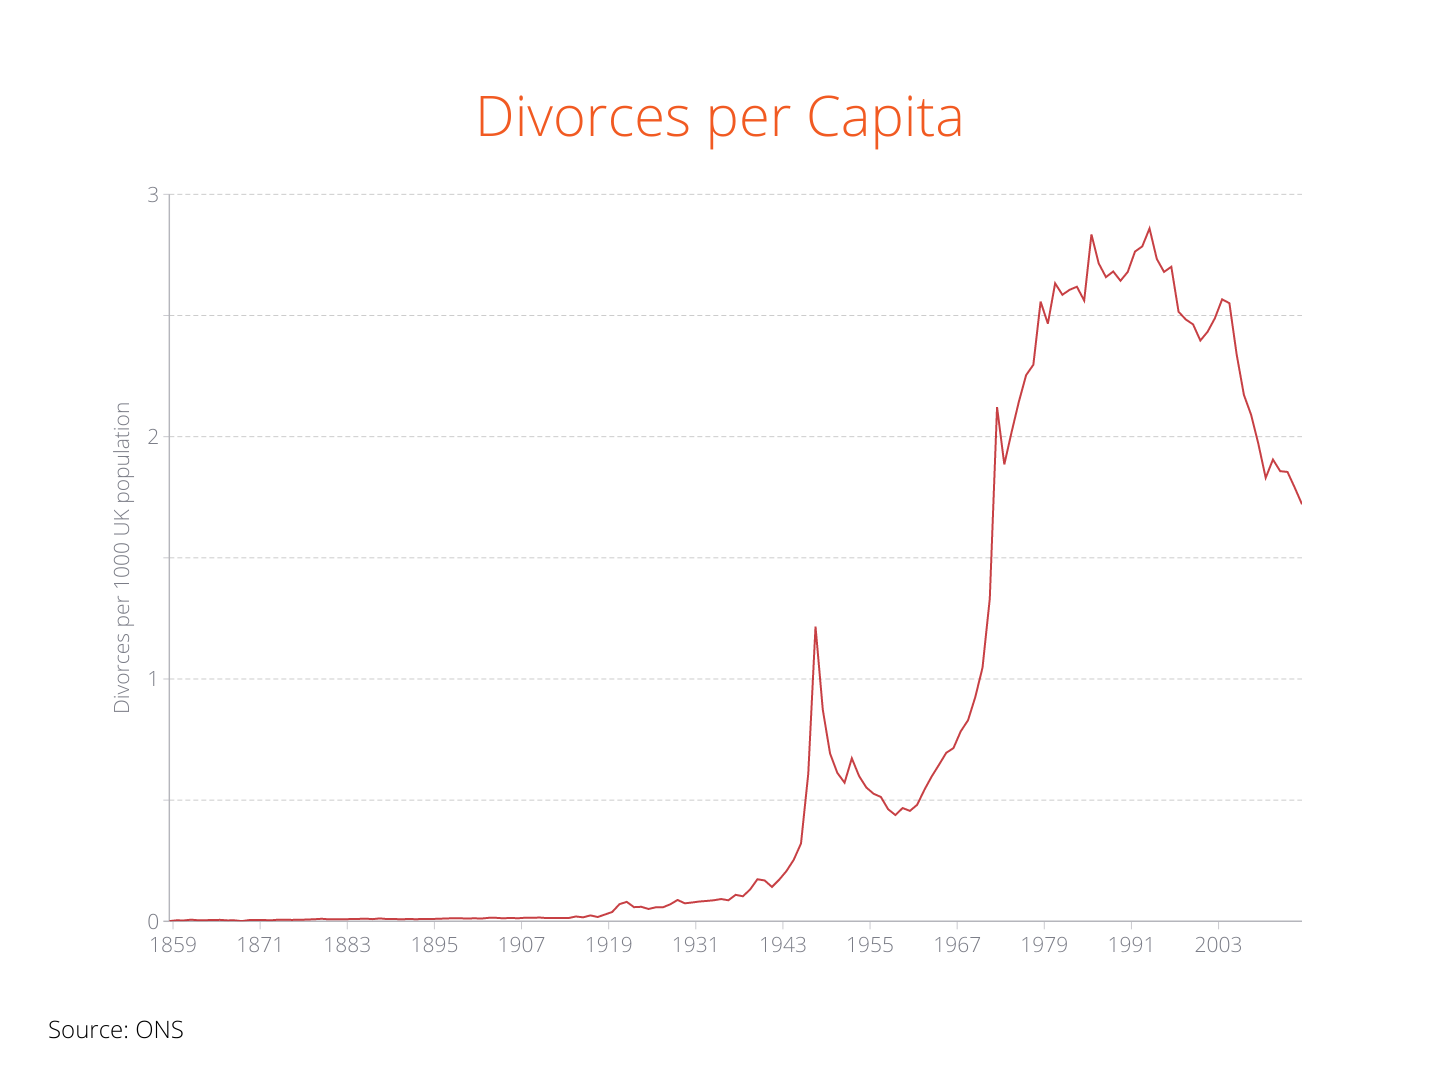
This raises the second problem, that of dynamic divorce rates. Divorce rates have varied very significantly over recent decades, generally (it is believed) due to changes in both legislation and social mores (see the chart above). Measuring a rate that is constantly changing always poses difficulties. Measuring outcomes over longer periods (e.g. years rather than months or weeks) can only deliver an average rate for that period, obscuring information about in-period variation in the rate. But measuring outcomes over shorter periods (e.g. the number of marriages and divorces per day) will shrink the size of the dataset for each period, providing more uncertainty about the true rate that is driving those outcomes. Our decision to use a forty-year rolling average certainly obscures the significant changes in marriage behaviour that have occurred within that period, but is a necessary compromise given the small number of royal marriages.
This touches on the final issue bedevilling the attempt to compare royal marriage outcomes with those of the population as a whole: the small sample size of the regal dataset. The problem here is that, for the purposes of judging the relative success of royal, non-royal, royal-to-aristocrat, and royal-to-commoner marriages, we want to know the underlying probability that each type will end in divorce. However, all we are able to observe are the outcomes, not the underlying processes. Small samples - through virtue of being small - provide less information (which is to say, more uncertainty) about the underlying processes. This means that we can’t just look at failure rates for each of these groups and draw definitive conclusions. For example, although around one in three marriages across the UK ends in divorce, fully four out of the last eight royal marriages ended that way - a failure rate of 50 percent. But perhaps the royals were simply unlucky: even if the royal divorce rate were one-in-three - the same as for everybody else - there would still be a 25 percent chance that eight randomly-chosen royal marriages would end in four or more divorces. In response to this problem, we’ve calculated a probability distribution - rather than a point estimate - for the ‘true’ royal failure rate, to facilitate comparison with the population as a whole.
Analysis
Royal and Non-Royal Divorces and Weddings Over Time
Before we try to calculate ‘true’ failure rates and so on, what does the data actually look like? As outlined above, calculating the percentage of marriages that end in divorce is actually not straightforward at all. The following chart therefore simply shows the ratio of the number of divorces to the number of marriages over a rolling forty-year window, for royals and non-royals. As touched on above, we count annulments, dissolutions, and the unrecognised marriage of George IV to Maria Fitzherbert as equivalent to divorces, and assume that as these options were extremely rare among the general public, the non-royal rate was effectively zero for these alternatives.
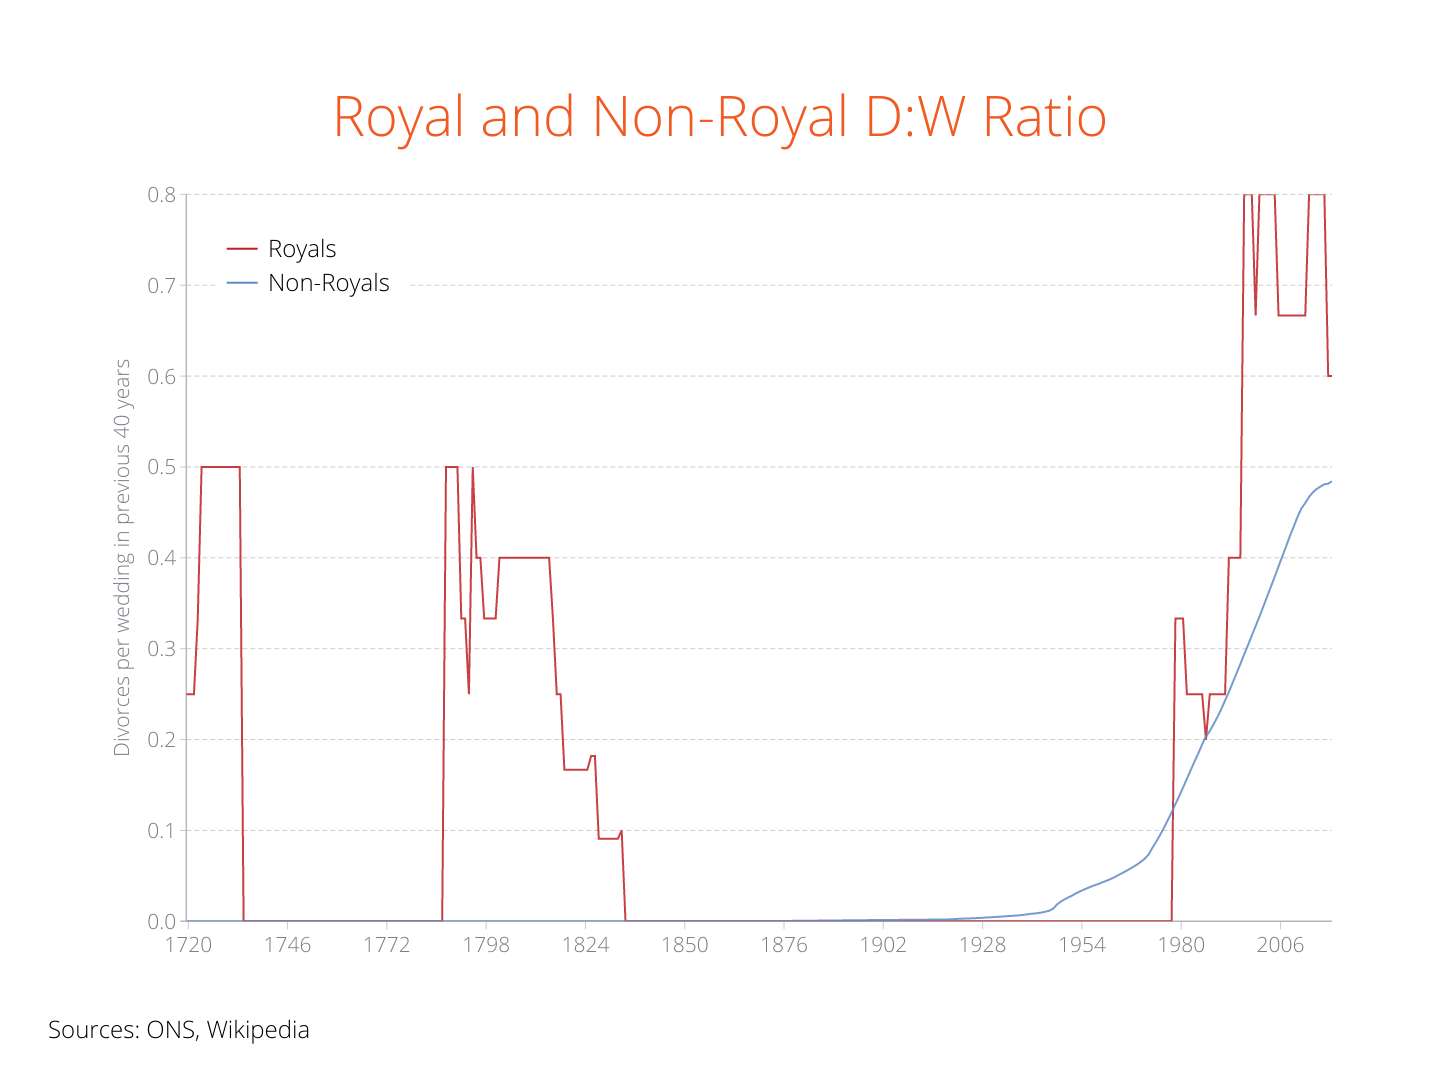
A first glance at the chart shows that royal marriages don’t always have fairytale endings. Prior to 1858, getting a divorce required an Act of Parliament, making the option largely the preserve of the aristocracy; the blip at the start of the series represents the dissolution in around 1694 of George I’s marriage to Sophia Dorothea on the grounds of abandonment, while the bulge starting at the end of the eighteenth century represents the officially-unrecognised marriage of George IV to Maria Fitzherbert in 1787, and the annulment of the marriage of Prince Augustus Frederick and Lady Augusta Murray in 1794, which had naughtily taken place in Rome without the consent of the groom’s father, who happened to be King George III.
For a happy 120-year period after 1858, while the general public was merrily availing themselves of the new option to get divorced, there were no royal splits. However, the royal divorce-to-wedding ratio took off with Princess Margaret’s divorce from Lord Snowden in 1978, followed by a skyrocketing as the number of royal weddings dwindled, and all three of the Queen’s married children got divorced between 1992 (her ‘annus horribilis’) and 1996. (The remaining child - Prince Edward - has remained securely in matrimony with Countess Sophie, whom he married in 1999, and at whose side he rules Wessex with an iron fist.)
However, it’s worth noting that the difference between the royal and non-royal series isn’t orders-of-magnitude. In the very worst years since 1996, the ratio of recent royal divorces to weddings topped out at 0.8, only about twice its value for the public at large. This could be an indicator that royals are bad at staying married, but it could also be bad luck with a small sample. What can we conclude about the underlying failure rate for different kinds of marriage, based on this imperfect data?
Royals and Commoners
What can we say about the relative failure rates of marriages between royals and aristocrats, royals and commoners, and commoners to each other? As we discussed above, it’s easy to work out the outcomes for royal marriages, since there are few of them and they are well documented. It’s harder to work out the outcomes for the general public, since although we know the numbers of weddings and divorces in any given year, we don’t know which divorces apply to which weddings. This is problematic if you want to know, for example, what proportion of marriages failed from 1921 onwards: we don’t know if a divorce granted in (say) 1925 applied to a marriage from 1920 or earlier (which would be outside the dataset of interest) or to one from 1921 onwards (which are within the dataset of interest).
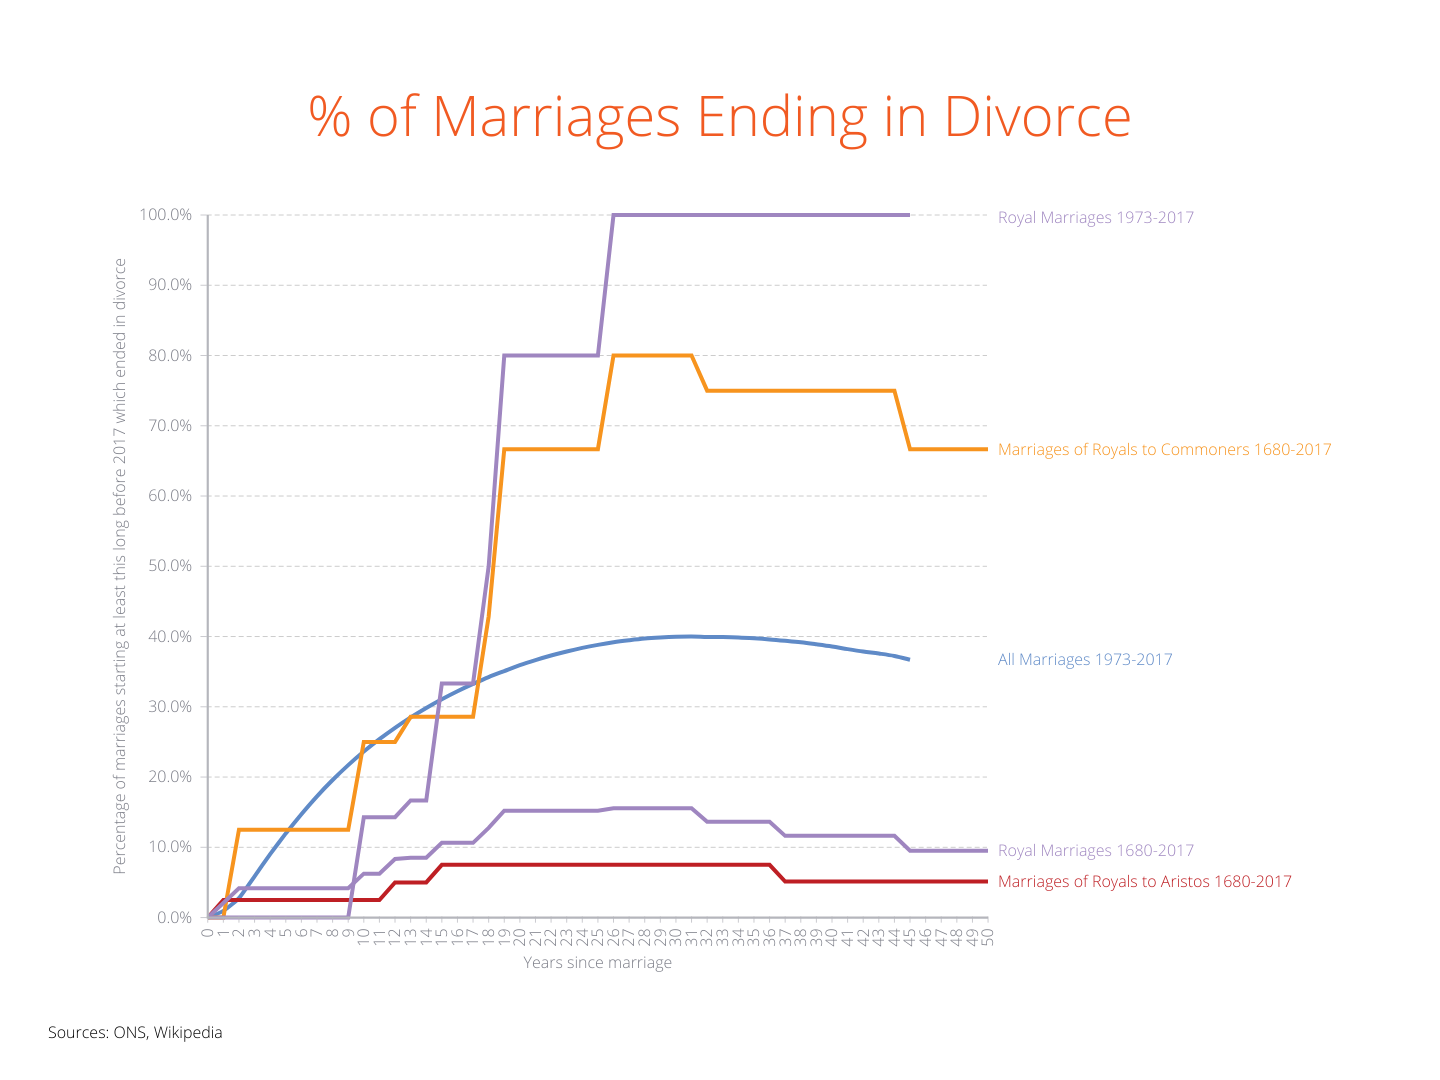
The ONS does publish data on the proportion of individual marriages ending in divorce after different lengths of time from 1973 onwards. The chart above depicts these figures, and the equivalent observed figures for different categories of royal marriage, including those since 1973, and for aristocrats and commoners. (A key aspect of this chart is that, for any given year, it only considers marriages for which outcomes are known. This means, for example, that the 100 percent divorce rate after 25 years, for royal marriages between 1973-2017, only accounts for marriages that lasted at least 25 years before 2017. The counterintuitive downward curve on some of the series arises from a similar issue, and implies that the older marriages in these categories were less likely to end in divorce than the newer ones.)
This means that we have to make a few assumptions to generate a reasonable figure for the observed failure rate of marriages in any given period. Our approach is based on National Statistics data from 1970 onwards that suggest that approximately half of all marriages that are going to fail, fail in the first ten years. This means that to estimate an observed failure rate for marriages between (say) 1950-1980, we take total weddings in that period, and compare it to total divorces between 1960-1990, on the assumption that Type I errors (e.g. marriages in 1949 that ended in divorce in 1961, erroneously included as ‘failures’ despite having taken place before 1950) are likely to be roughly offset by Type II errors (e.g. marriages in 1980 that ended in divorce in 1991, erroneously included as ‘successes’ in the dataset despite having led to a divorce). Not ideal, but transparent and reasonable.
The observed failure rates for the different pairings (using the above approach for estimating the general public failure rate) are shown in the chart below. Because of this approach, which relies on ten years of divorce data after the end of the period, observed rates only cover periods to 2011.
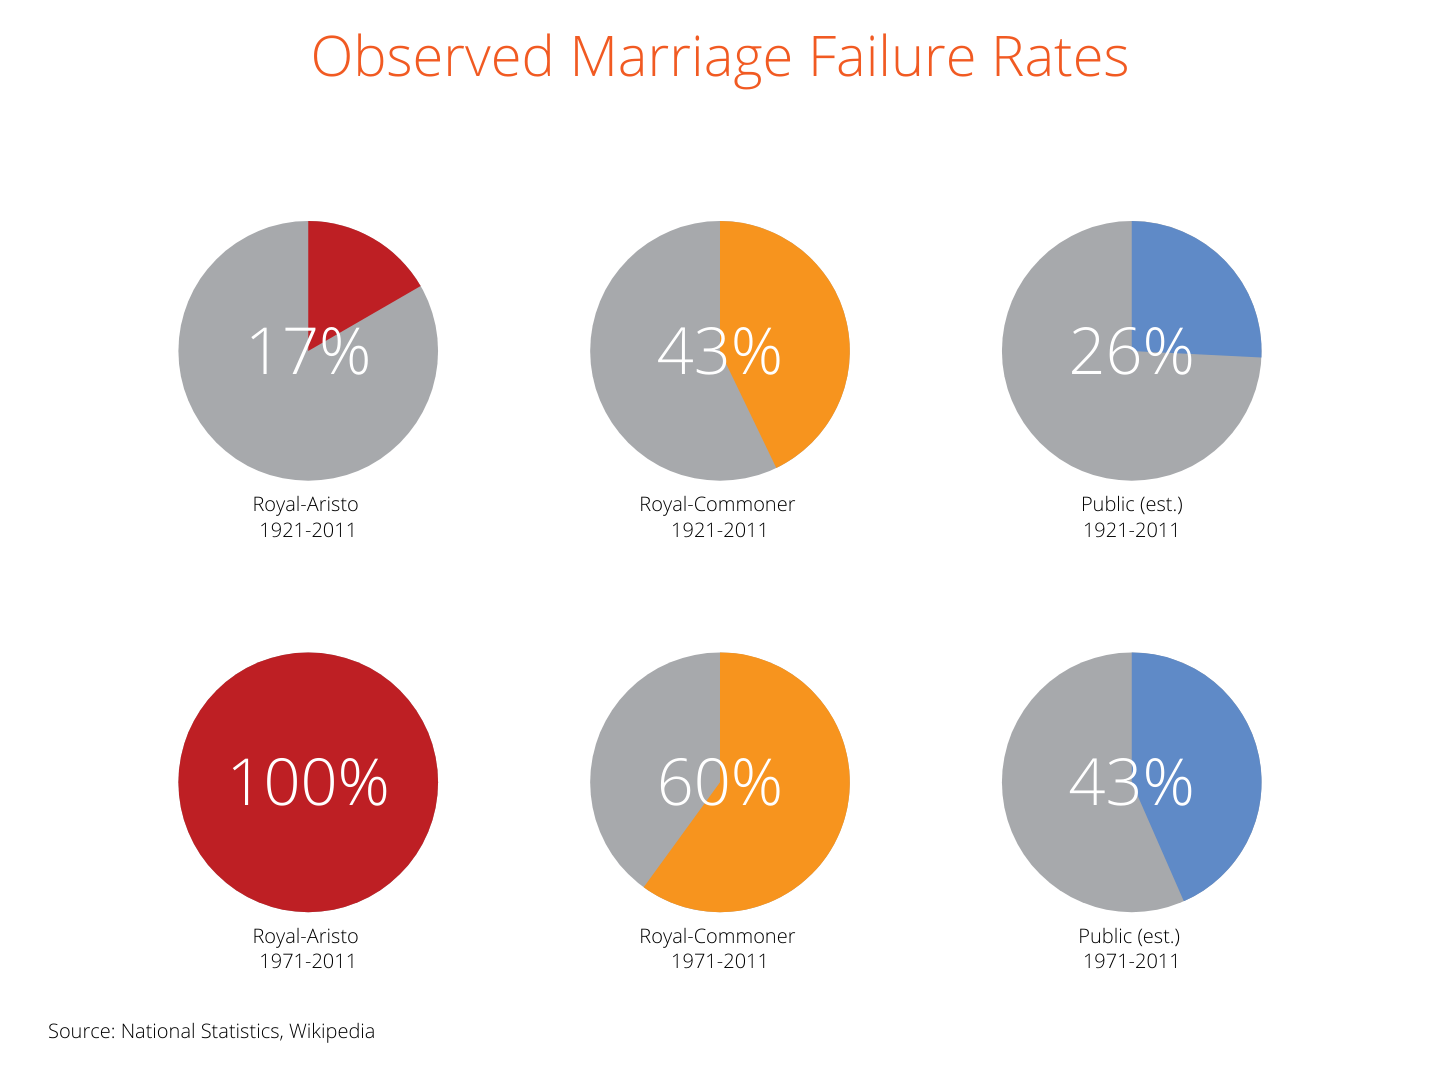
The startling 100 percent failure rate for royal-aristocrat matches since 1971 is in fact entirely accounted for by the marriage of Prince Charles to Lady Diana Spencer. Perhaps surprisingly, the other five royal weddings (even under our restricted definition, which excludes those of Princes William and Harry) have been to technical commoners, comprising Mark Phillips, Sarah Ferguson, Timothy Laurence, Sophie Rhys-Jones, and Camilla Parker-Bowles.
The charts suggest that failure rates have been higher for all categories in the 1971-2011 period, than in the 1921-2011 period - no surprises there. For both periods, royal-commoner marriages failed at a greater rate than for the general public, while the royal-aristocrat failure rate is driven entirely by Charles and Diana’s divorce. As we touch on in the ‘Methodology’ section above, the only way to deal with this small sample problem is to explicitly account for the uncertainty it drives. The most reasonable way to do this is to derive a probability distribution for the failure rate, based on the likelihood of observing these outcomes with the sample sizes available. The charts below illustrate these distributions for the three categories of marriage, and two time periods, examined.
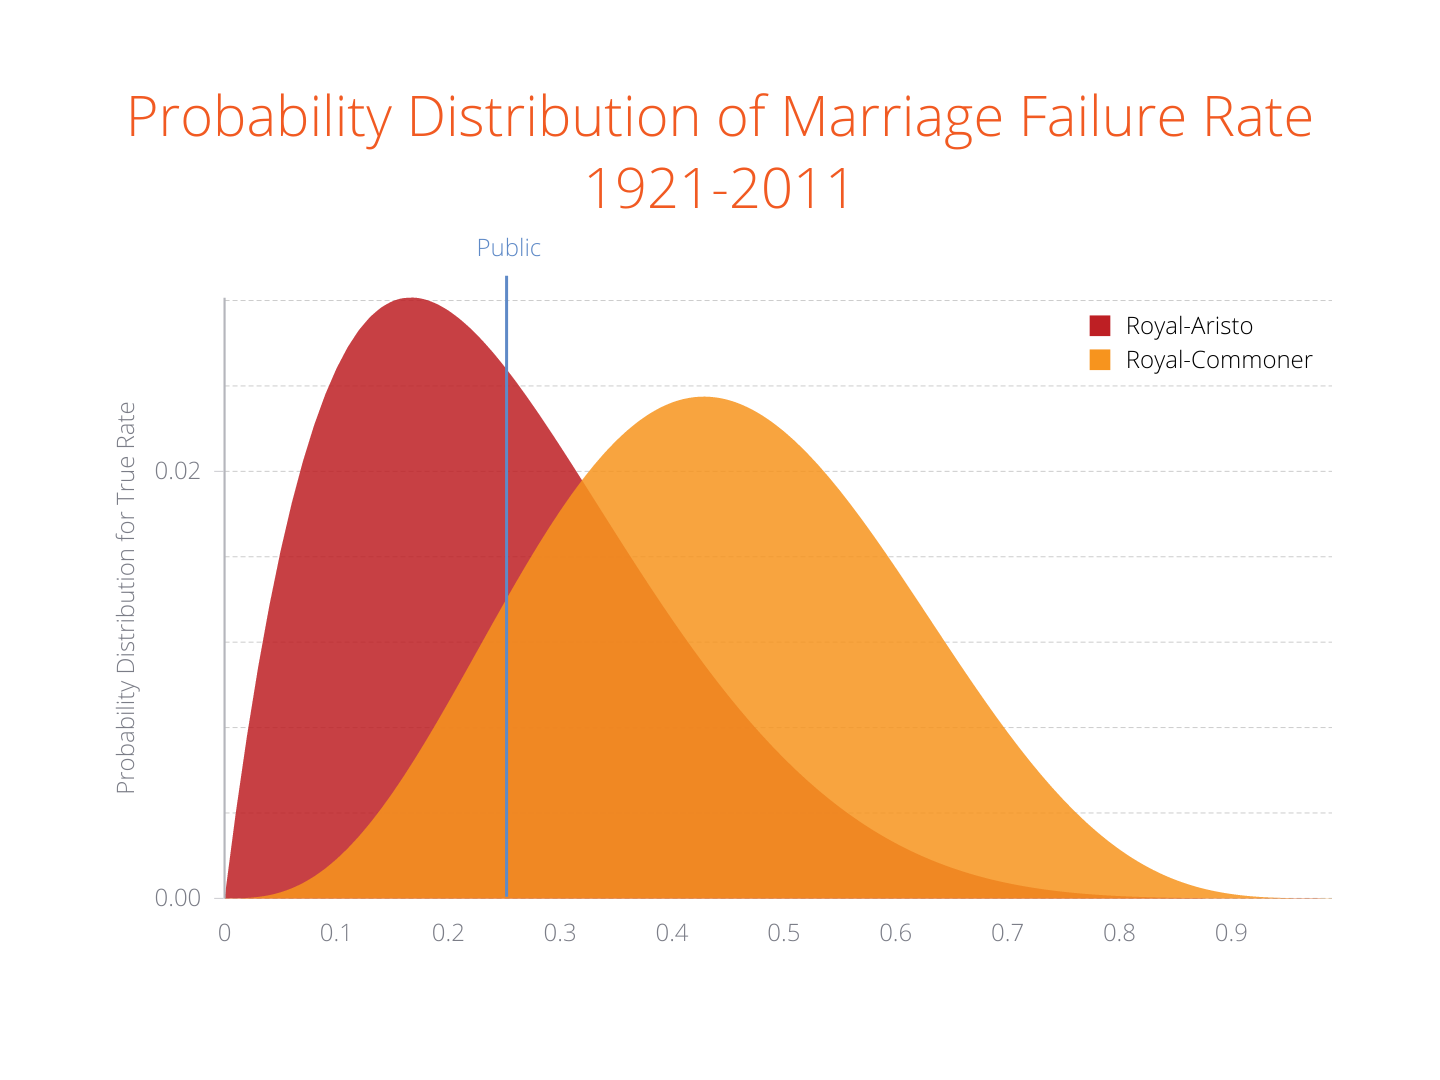
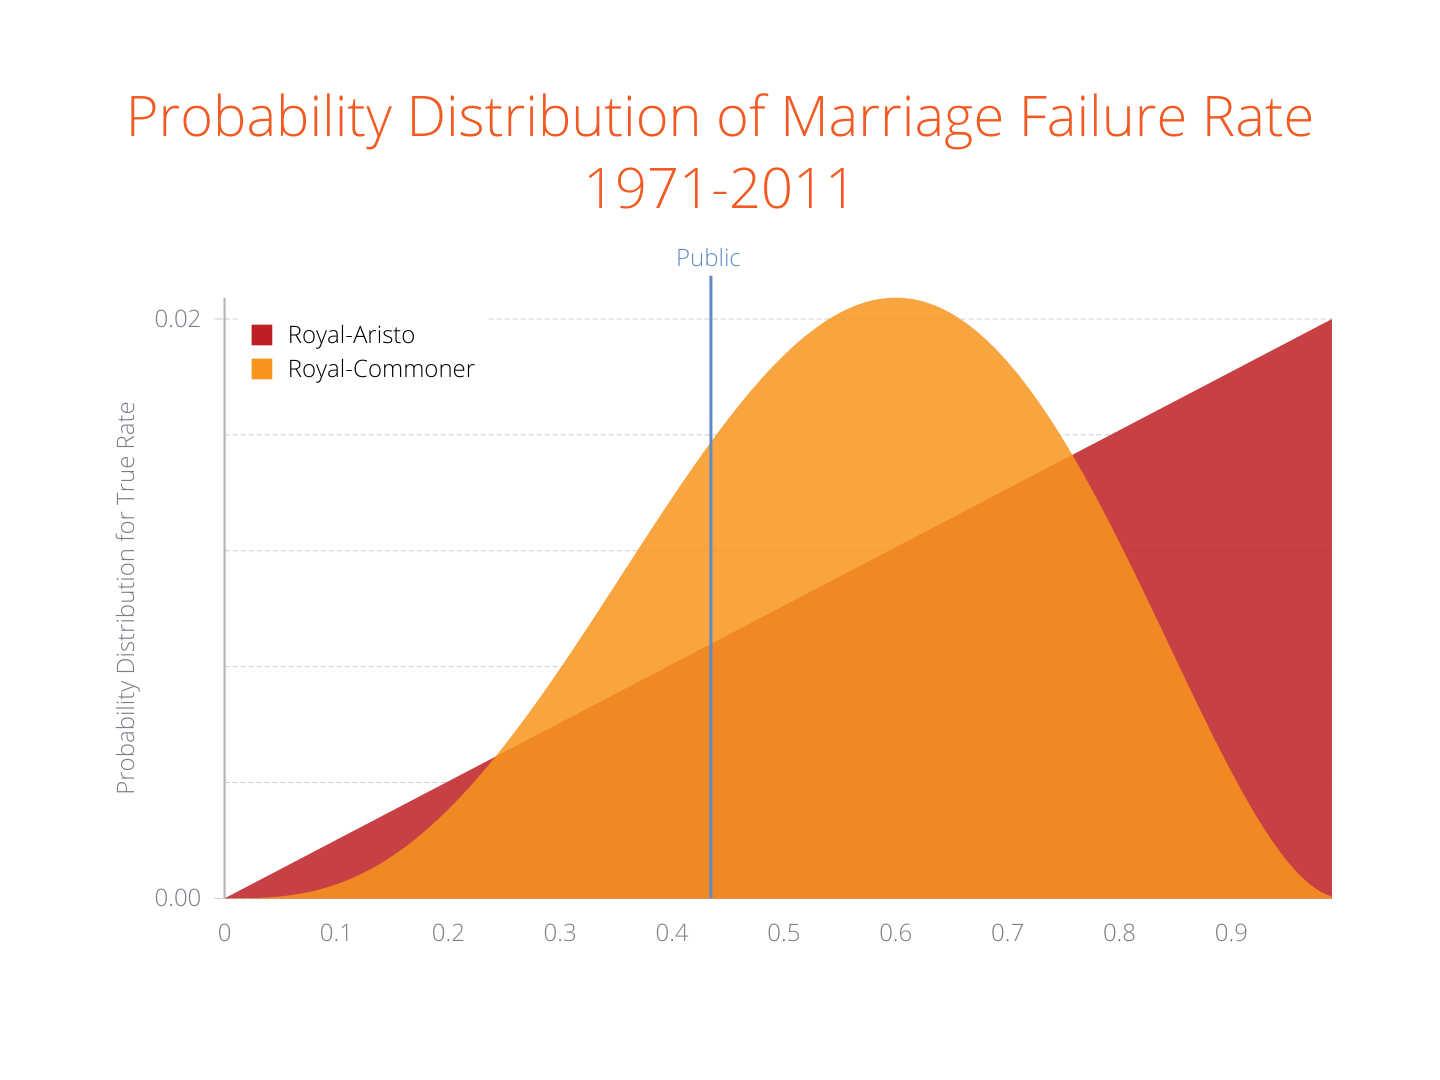
These charts suggest that over the longer period of time (1921-2011), it’s reasonable to think that royal marriages to aristocrats were slightly less likely to fail than marriages among the general public, which were in turn less likely to fail than marriages between royals and commoners. But for the more recent period, it’s reasonable to think that all royal marriages were more likely to fail, with marriages between royals and other aristocrats at greatest peril.
However, an extremely important observation from these charts is that all the royal marriage failure rate distributions deposit sizeable amounts of probability either side of the general public failure rate. What this suggests is that, despite the high-profile divorces of royal marriages in the last few decades, it can’t be ruled out that the royal family has merely been somewhat unlucky. Based on the data alone, there’s about a 20% chance that royal-to-commoner marriages are actually less likely to fail than those of the wider populace.
Conclusion
Matrimonially-speaking, the royal family has had a rocky few decades. It’s easy to fit this into a narrative about the incompatibility of the royal family’s lifestyle - or even their personalities - with long-term commitment and to bolster this story with the high ratio of divorces to marriages. But the salient fact about the royal family is that there aren’t very many of them. This makes standard approaches to statistical comparison tricky, but using more-sophisticated approaches can help us account for the uncertainty that small samples generate. And in this case, it turns out that actually the royals aren’t spectacularly bad at staying married, either to aristocrats or commoners, and that they might just have been unlucky.
In conclusion, you shouldn’t marry into the royal family with the expectation that you’ll have a higher chance of a long and happy marriage. But neither should you be deterred by memories of the scandals of the 1990s. We wish you well whatever you decide.
MOD/Crown Copyright Picture: SAC Gareth Little