
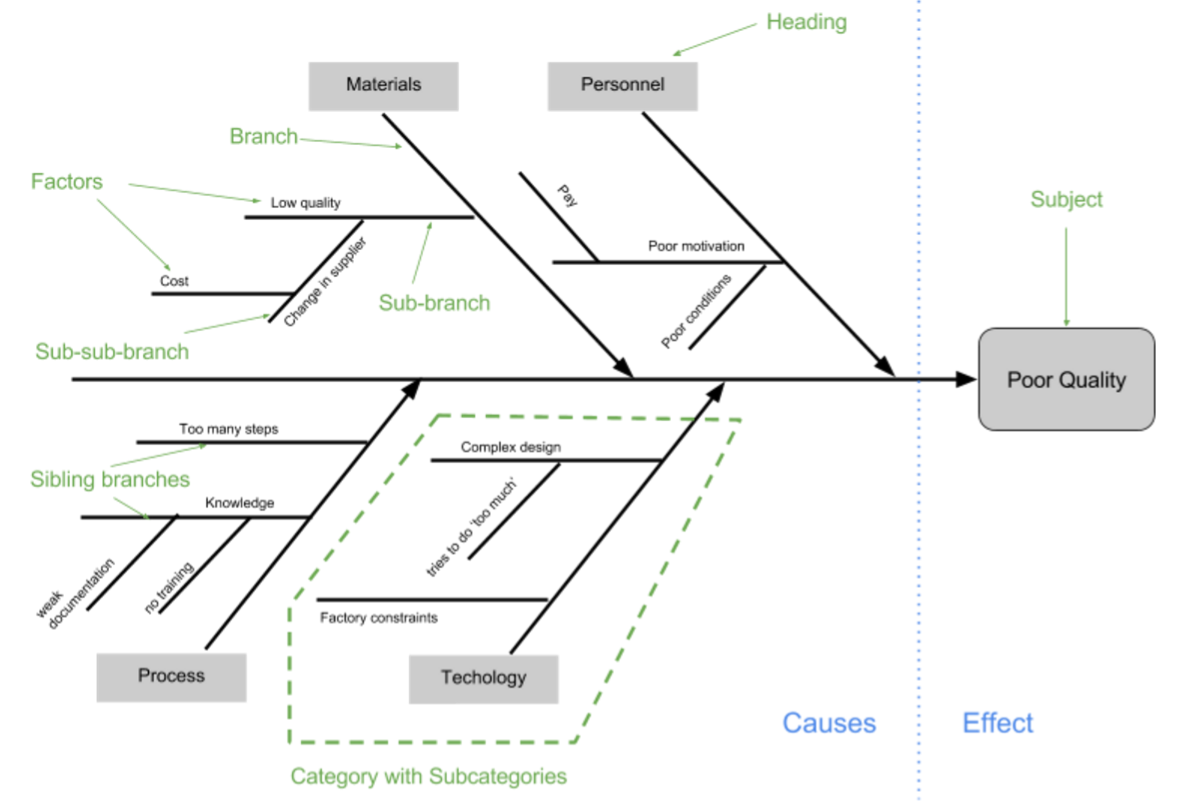
Another example of a popular and effective low-tech analytical tool is the 'Cause-Effect diagram' (aka Herringbone or Ishikawa diagram). As the name suggests they are appropriate for identifying and delineating possible causal relationships. Examples include the ways a plan might fail, the causes of an accident or bottlenecks in processes. As with the previous post examining SWOT analysis we won’t provide yet another ‘how to’ - there are lots of excellent guides out there, but to look a little further into what is going on when an analyst goes about using such a method, to add robustness to the approach and encourage adaptation.
So what’s going on? Lets examine some of the things that seem to be happening when this method is used. There seem to be a few mechanisms in play:
- Selecting and specifying the subject.
- Choosing the framework - selecting top-level headings to suit the question.
- 'Ideation' - identifying and recording 'factors' relating to the question
- Sorting and categorising ideas
- Turning the output into action
Specifying the question: As observed in the previous SWOT post, there is an important process of electing a manageable but useful scope to address. I won’t go into more detail on this (it is probably worthy of it’s own post). However selection of an appropriate framework of headings is an important element of this method which is informed by the scope/questions selection.
Choosing the framework: Various guides suggest different collections of top level headings (choose from 5 Ms or 8 Ms in manufacturing, 7 Ps in marketing or 5 Ss in service industry) to provide the first level of features. These top level headings provide broadly (woolly) defined causes, as additional layers of detail are added these causes become more clearly defined. These top level headings serve as a set of categories for sorting factors.
Naturally, it is important to choose headings which you consider likely to give you good coverage of the scope decided in the step above, so, for example, if human error is though to be a root cause of the error under examination then 'PEOPLE' (or other appropriate category) should be included. Be aware, that the framework may limit ideation: Any prescriptive set of categories may limit ideation, so, these stock frameworks should be used with discretion, they can provide useful suggestions of things to think about, but do not feel pressured to 'force' ideas in order to satisfy an empty heading and likewise, feel free to add more categories if those pre-selected don't fit your ideas.
Presenting this outline structure which assists ideation. There seems to be a mode of thought while 'generating' ideas which is assisted by considering a single branch (category) at a time. This reduction in scope, seems to make it less cognitively demanding in some way. It is easier often to come up with an answer a series of questions, "What 'people'/'environment'/'equipment'... factors caused this?" than to answer the more general "What factors caused this?".
Ideation
Guides for this method often suggest asking the question “what are the causes for this?” or “why?” to prompt ideas. This seems to play on the power of the human mind for generating narrative style explanations for observed phenomena. The categories already present provide a subject for the guiding question, and the question prompts you to seize at available possible causes from experience or imagination. The method seems to be making good use of the Availability Heuristic to reduce the burden of ideation. However, watch out, the first thing to come to mind is not necessarily the most important factor. To assume this is to succumb to a natural and powerful bias (the 'dark side' of the heuristic). Try asking your self "Why else?" to generate more ideas on the theme until it becomes exhausted.
It’s clear that when you are ‘generating ideas’ (or perhaps, recalling things you already know) the visible categories help guide you to bits of your memory that contain useful/relevant concepts. It seems to me that this plays to the strengths of the associative nature of the human memory, you might ask yourself “What are the possible PEOPLE causes of this problem” and by recalling the PEOPLE concept in your mind there are other ‘proximate’ concepts which come readily to mind. And as with SWOT the diagram and pre-selected categories provide a handrail to both prompt and sort ideas.
The ideas already present as well as the categories themselves (and the associated 'conceptual baggage') provide a useful prompt to the brainstormers. In this sense it is similar to SWOT, as mental short cuts can be used to find which are similar factors and add them to the diagram with less cognitive load than if they were generated from fresh.
It is important that the question asked is relevant to the task. Furthermore, to prevent the output being ambiguous and confusing the question should be and consistent. Avoid mixing cause-effect questions such as 'why?' with other relationships. There may be a temptation to try to explicit capture temporal relationships - perhaps by asking "What came before?", If this in relevant and interesting, consider a different, separate analysis.
Categorisation:
When a participant comes up with an idea, and then wants to place it on the board, they will generally already have a category in mind - the category was the prompt. The guiding question invites a critical analysis of the category, and from that an idea is generated.
In some cases, ideas come out which are not driven by the guiding question. In these cases there is a need to switch between ‘creative' and a ‘critical’ mode of thought to assign the idea to an appropriate limb. If they can’t find a suitable category to ‘hang’ the idea off, they may be dissuaded and assume that the idea is ‘wrong’ in some way. A good facilitator will invite people to put any ideas up, using the white space around the diagram, and worry about categorising/judging ideas later. The categorisation scheme can be used to sort ideas by looking for parent classes that the thing in mind is NOT like, just as much as finding it an appropriate parent. By elimination of candidates a home may be found.
Although this form of categorisation feels like concepts go though a process of gross simplification (and therefor data loss), this is only surface deep. By associating concepts with a parent class they inherit a great deal of information in return. The association with other siblings, and a proper place in the hierarchy (e.g. level relative to other items) tells you a great deal, implicitly, about the item in the tree.
The order in which one chose to do things is again a matter of preference, but the the two ‘modes’ (creative/critical) of thought seem to occur at some point whatever approach the participants take to the task. So, mechanistically, it is very similar to a SWOT: Ideas are generated (or recalled) and then sorted. Where this process differs significantly from SWOT is the structure into which the ideas are placed. Consider two parts to the structure of the ideas:
- Visual Structure of the diagram and
- Logical Structure of the guiding questions
Logical Structure: The guiding question is clearly a powerful aid in ideation, but more than this it provides a prototype for the relationship between all the factors captured in the diagram. By asking a guiding question such as 'why?' means that a level of ‘meaning’ woven into the output: information about the causal relationship between any ‘bone’ or branch and its subordinates is implicit in the relationship between the parent-child branches in the hierarchy. The link between any bone and the it's superior is the answer to the question: 'BRANCH...because...SUB-BRANCH'.
This is extra information, that the structure (layout) helps you visualise and capture. So, a doctrinally pure Cause and Effect diagram represents an understanding of sequential causality, and hence implicitly includes temporal information in the relationship between the concepts: the small bones must exist before their bigger parent bones. With each step ‘down’ from branch to sub-branch you are trading breadth of scope for specificity while moving back through time and sibling sub-branches share an implicit relationship via the parent branch’s broader meaning.
Visual Structure: The SWOT diagram invites only one level of categories, which is fixed at 4 all ideas must be made to fit into on of the ‘holes’. With this method we have potentially many more. For example, we might at the start, have 1 of 8 Ms to choose, but as we drill down adding more layers, we potentially have more and more sub-categories which in turn may have their own sub-categories. And if the situation arises that ideas don’t ‘fit’ into any existing categories, then new ones can be appended. So, in this way the visual structure is extensible both horizontally (number of bones) and vertically (number of levels of sub-bones).
The fish bone shape, with distinct hierarchy and slanting bones and a ‘head’ makes use of the semiotic 'baggage', there is a sense of ‘pointing’ forward from which the human reader infers the temporal/causal relationship. You are left with a sense that a number of sub-things lead to the higher thing. The completed diagram represents a set of stories which tell how various factors fell into sequence to cause the main focus of the analysis.
Keep in mind that the fish bone shape aids this inference. For some problems this may not be appropriate. For example if you are not looking for temporal or causal relationships between factors then you should question if the fish shape it appropriate - does the shape complement the logic of the question that drives the relationship between elements and their parents and children?
When completed and agreed as a group it represents a shared and accepted vision of events. This is often a useful consensus to build for subsequent group action.
Commonalities: What is clear is that there are certain common mechanistic activities which are present in both SWOT and cause-effect diagramming:
- Specifying the question: Selecting a usefully broad, but answerable narrow scope.
- Coming up with and recording ideas: Ideation, recall and capture.
- Sorting ideas: Critical consideration and classification.
As we have discussed, it is important not to allow the structure and choice of categories to be too prescriptive. This is a theme which we shall examine further in the next post providing a critical examination of another common visual analytical method, Mind Mapping.