
In the last post, we defined a 'confidence statement' as follows:
"I have confidence C that hypothesis H has probability P."
in the context of our quest to find a meaningful interpretation for this kind of thing.
People with some statistical training often begin instinctively to analogise to 'confidence intervals', and specifically about the 'probability' element. Is confidence related to a confidence interval around the 'P' figure? The idea here is that if we think the true figure for P is between 55% and 65%, perhaps we will have a higher confidence than if we think it's between 40% and 80%?
The idea that analytical confidence - confidence in the stated probability of a hypothesis - is something to do with confidence intervals carries a lot of problematic baggage. It presupposes that we can talk meaningfully about ranges of probabilities. This idea is much more complex than it seems, and we'll look at it in a forthcoming post. But before we look at that idea in detail, it is worth setting out for non-statisticians what a 'confidence interval' is. In particular, it's important to realise that a 'confidence interval' is a range of hypotheses. It's not possible to ascribe a 'confidence interval' to a specific hypothesis, such as 'H' in the generic sentence above. To explain exactly why, we'll need to look in a bit more detail at two types of hypotheses: orderable, and non-orderable.
Orderable and Non-Orderable Hypotheses
A lot of the hypotheses we are interested in for the purposes of everyday decision-making do not in general have a natural ordering about them. If I'm planning a driving trip and thinking about things that can go wrong, the list of hypotheses might include:
"I run out of petrol."
"I get a flat tyre."
"My car's engine fails."
"I crash into a lamp-post."
and so on. These hypotheses are not meaningfully orderable. Of course, you could put them in alphabetical order, or arbitrarily number them, but the phenomena they describe are not naturally more or less of each other; engine failure is not a particularly extreme form of flat tyre, for example.
Photo: Ildar Sagdejev
But that doesn't mean we can't attach probabilities to them, using available data and the usual inferential methods, e.g.:
"I run out of petrol." (p=0.1%)
"I get a flat tyre." (p=0.2%)
"My car's engine fails." (p=0.2%)
"I crash into a lamp-post." (p=0.01%)
If I'm planning a train trip, I might instead consider the following hypotheses:
"The train is delayed by 0-1 minutes"
"The train is delayed by 1-2 minutes"
"The train is delayed by 2-3 minutes"
"The train is delayed by 3-4 minutes"
(and so on, forever)
These hypotheses are meaningfully orderable, in terms of the length of the delay which the hypotheses propose. As with the non-orderable hypotheses, we can attach probabilities to them, using available data and the usual inferential methods, e.g.:
"The train is delayed by 0-1 minutes" (p=40%)
"The train is delayed by 1-2 minutes" (p=24%)
"The train is delayed by 2-3 minutes" (p=14%)
"The train is delayed by 3-4 minutes" (p=9%)
(and so on, forever)
If you're not used to doing quantitative analysis, you might at this point wonder why the orderable / non-orderable distinction is supposed to be interesting. The answer is that with orderable hypotheses, a whole range of mathematical techniques become available that simply don't work with the non-orderable type. For example, we might be able to use a simple mathematical equation to describe the probabilities (a 'distribution') that will then act as a shorthand for the big table of hypotheses above. In fact, we don't even need to break the hypotheses into minute-long chunks - we can just treat every possible length of delay as a separate hypothesis. There'll be an infinite number of these, but as far as the maths is concerned, this isn't a problem. If we drew a picture of the probability distribution, it might look something like this:
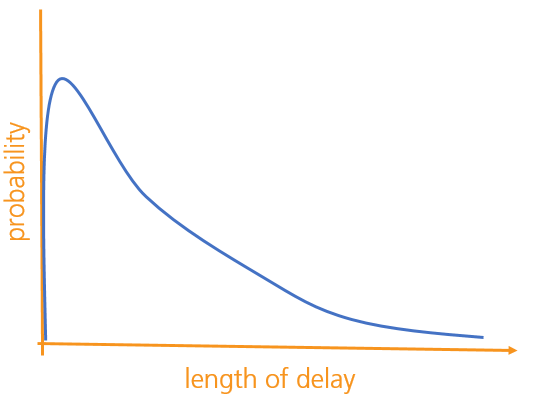
We might then be able to find some interesting metrics about this distribution, like its mean, standard deviation, maximum and so on. One important thing to bear in mind, though, is that each hypothesis - each possible delay-length - has just one probability associated with it, and not a range of them.
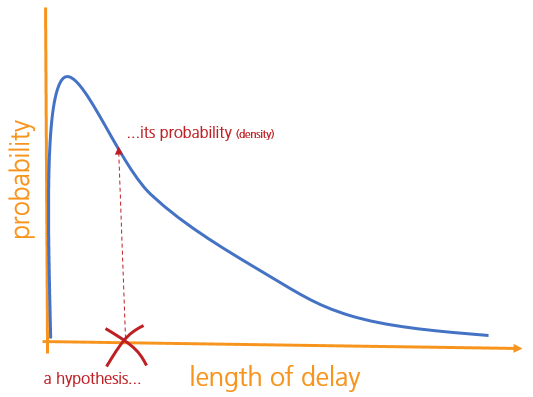
(Strictly speaking, each hypothesis has a probability density associated with it. But if you're a statistician you'll know this already, and if you're not, you probably don't need to worry about the distinction.)
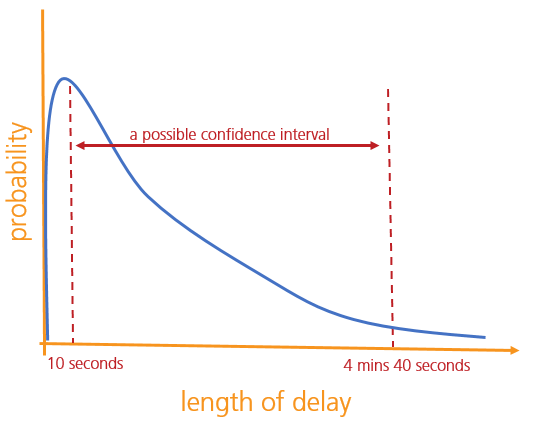
Now a 'confidence interval' is a range of hypotheses that have some relationship to what we might think of as the 'true' value of the thing we're interested in. A '95% confidence interval' for the train delay length - given whatever information we have - might be 'between 10 seconds, and 4 minutes 40 seconds'. This would mean something like that there is a 95% probability that the train will be delayed by between 10 seconds and 4 minutes 40 seconds. (This definition is wrong, but not too wrong. There's no way to define exactly what a confidence interval means without getting overly technical for our purposes.)
The key thing to note though is this:
A confidence interval is a collection of hypotheses; it's not a concept that can be meaningfully applied to a particular hypothesis.
With that point established, in the next post we'll look at the various competing theories of 'analytical confidence', before examining them closely to see which ones hold water.