
There was a common type of study published yesterday, which linked the number of fast food outlets with nearby obesity and diabetes rates. It's a common mantra in the field of methodology that 'correlation is not causation'. This isn't strictly true. First, it might be the case that causation is, on a fundamental sort of level, nothing more than a very strong set of correlations. Second, even if correlation and causation are not semantically equivalent, it's often the case that correlation is extremely good evidence for causation, and this should never be ignored. Having said that, if people can only remember one thing about 'correlation' from their stats classes, 'correlation is not causation' isn't a bad candidate to promote good practice and scepticism about claims.
When, as an analyst, you have established a correlation between two features of the data A and B, there are always five distinct families of hypothesis you should bear in mind to explain it:
1. A causes B. Perhaps obese or diabetic people choose to live near fast food restaurants?
2. B causes A. Perhaps fast food restaurants nearby encourage people to become obese?
3. A and B are caused by a separate factor C. Perhaps poor people are more likely to be obese or diabetic, and fast food outlets tend to open in poorer areas?
4. The data are a coincidence. Perhaps it's just chance that these two things occur together in the study data?
5. The data are wrong. Perhaps diabetics are more likely to be diagnosed in urban areas with more fast food restaurants, and rural diabetics are just not being picked up?
An observed correlation, by itself, will provide evidence in favour of hypotheses in any of these categories. Only additional features of the data will help you sort between them.
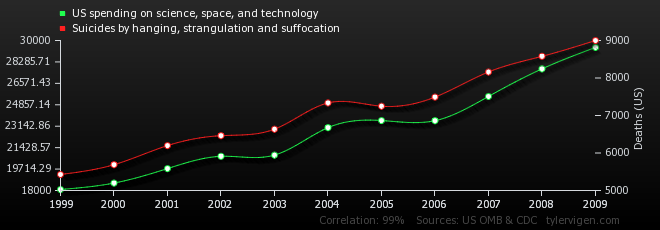
The website Spurious Correlations allows you to generate your own correlations from a number of data sources. As an analytical exercise, force yourself to come up with causal hypotheses to explain them.