
The so-called 'Pareto Principle' states, of systems to which it applies, that 80% of something is distributed within just 20% of something else, and vice versa. People will often mention this in the context of allocating effort: if 80% of work is done in the first 20% of time, it might be better to produce five things 80% well rather than one thing 100% well. Although it's frequently and often inappropriately cited by charlatans as an excuse for doing things badly, the Pareto Principle does have a mathematical basis in that many systems and processes produce a 'power law' distribution that can sometimes roughly follow the '80:20 rule'.
Interestingly, information-gathering, at least within a fairly abstract model, is one of these processes. 'Information' here is here defined fairly standardly as anything which would change a probability. As is often the case, we can use an 'urn problem' to stand in for a range of real-life analytical and decision problems. Here, there are two urns containing different-coloured balls:
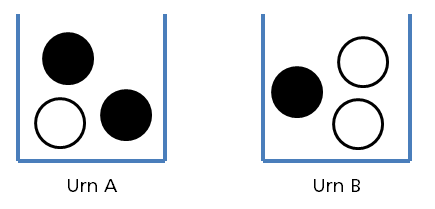
One urn is chosen at random (50-50) and the other destroyed. You need to work out whether Urn A or Urn B has been chosen - because you win £1m if you guess correctly. Balls are repeatedly drawn out of the chosen urn and then replaced.
Every black ball that is drawn increases the probability that Urn A is the chosen one. Every white ball concomitantly reduces it (and increases the probability of Urn B). The impact on probability is very well-understood: each ball doubles the odds of its respective associated urn. If we start with odds of 1-1 (representing 50% probability of each urn), a black ball will increase the probability of Urn A to 2-1. A second black ball will increase it to 4-1. If we then draw a white ball, the odds go back down to 2-1, and so on. If Urn A was chosen, the number of black balls would gradually outpace the number of white balls (in the long run) and the assessed probability of Urn A would creep closer and closer (but never actually equal) 100%.
Because the odds ratio - which is what information directly affects - is related to the probability in a non-linear fashion, we end up with a Pareto-Principle-type effect when looking at probability compared to information quantity (i.e. number of balls drawn). In fact, the relationship between probability and information quantity, on the assumption that the target fact is true, looks like this:
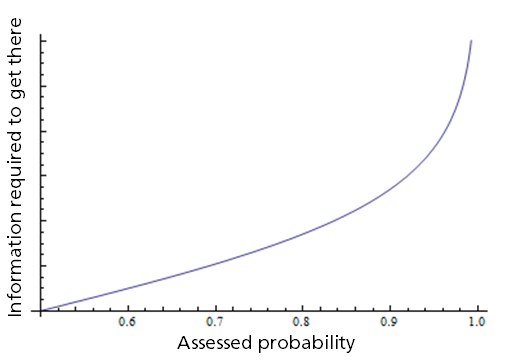
The relationship between information and probability is fairly linear from 50% to about 80%. Above 90% the curve steepens dramatically, and on the assumption that information continues to be drawn from the same sample space (e.g. the same urn, with replacement) it edges closer and closer to 100% with increasing amounts of information, without ever reaching it.
The implication is something that most analysts realise intuitively: there is a diminishing marginal return to information the closer you are to certainty, in terms of the impact it has on the probability of your target hypothesis. The amount of information that will get you from 50% to 80% probability will only take you from 80% to about 94%, and from about 94% to about 98%. Because the expected utility of a decision scales linearly with probability (in all but exceptional cases), there is indeed an 'optimal' level of information at which it will be better simply to make a decision and stop processing information.