
Overconfidence is a prevalent and well-documented phenomenon. Its practical manifestation is the effect it has on people's probability judgements. The overconfident analyst places probabilities on hypotheses or scenarios that are unwarrantedly close to 0 or 1, effectively expressing a higher level of certainty than the evidence supports. Overconfidence exposes decision-makers to the risk of bad decisions and has an unambiguously negative effect on expected returns under uncertainty.
Overconfidence is also relatively easy to measure: it manifests itself as miscalibration, which occurs when (for example) significantly more than 10% of statements assigned a 10% probability actually turn out to be true. This is easily depicted graphically, such as in Tetlock (2005):
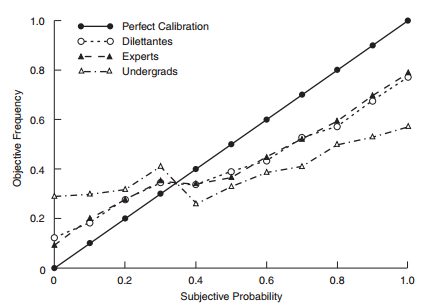
Tetlock (2005)
Here, 'subjective probability' (the x-axis) is the probability actually placed by participants on the (numerous) statements in Tetlock's study. 'Objective frequency' is the observed frequency with which those statements subsequently came true. The shape of the observed calibration curves (the dotted lines) has been replicated in a number of other studies including an unpublished small-sample survey of UK government analytical product my team conducted in 2012.
Analyses of overconfidence tend to take a descriptive statistical or psychological approach. Psychologists have proposed various decompositions of the mechanisms driving overconfidence, including 'support theory', 'random support theory', 'probabilistic mental models' and others. These aim parsimoniously to identify sets of heuristics that account for observed deviations of probabilistic judgements from observed frequency.
I have found that an abstract approach, rooted in the theory of inference, and almost certainly not novel, replicates some of the observed findings using a single parameter that might stand in for a range of mechanisms. An ideal inference machine would produce a probability that is essentially a summary of the quantity of information received, expressed in terms of Shannon information content (a standard and powerful information-theoretic concept). If we apply a single modifier to information content - as though we were over- or under-estimating the quantity of information received - this produces calibration curves that are similar to the observed data:
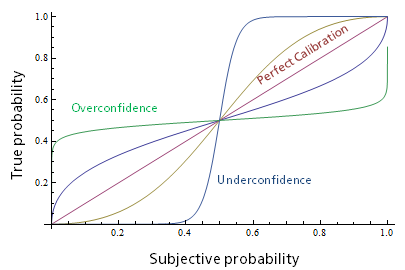
(The family of functions is: estimated probability = p^k / (p^k + (1-p)^k), where k is an 'overconfidence parameter' modifying information content, and p is the subjective probability. This can be straightforwardly derived from the relationship between binary probability and Shannon information content.) The simplicity of this function, which has only one parameter, might make it useful for modelling the impact of miscalibration on decisionmaking, whether or not it corresponds to any real psychological mechanism.